QIMA 2017 Q3 Barometer
QIMA Q3 Barometer:
Quality, Safety, Ethics: Supply Chains Still Struggle in 2017
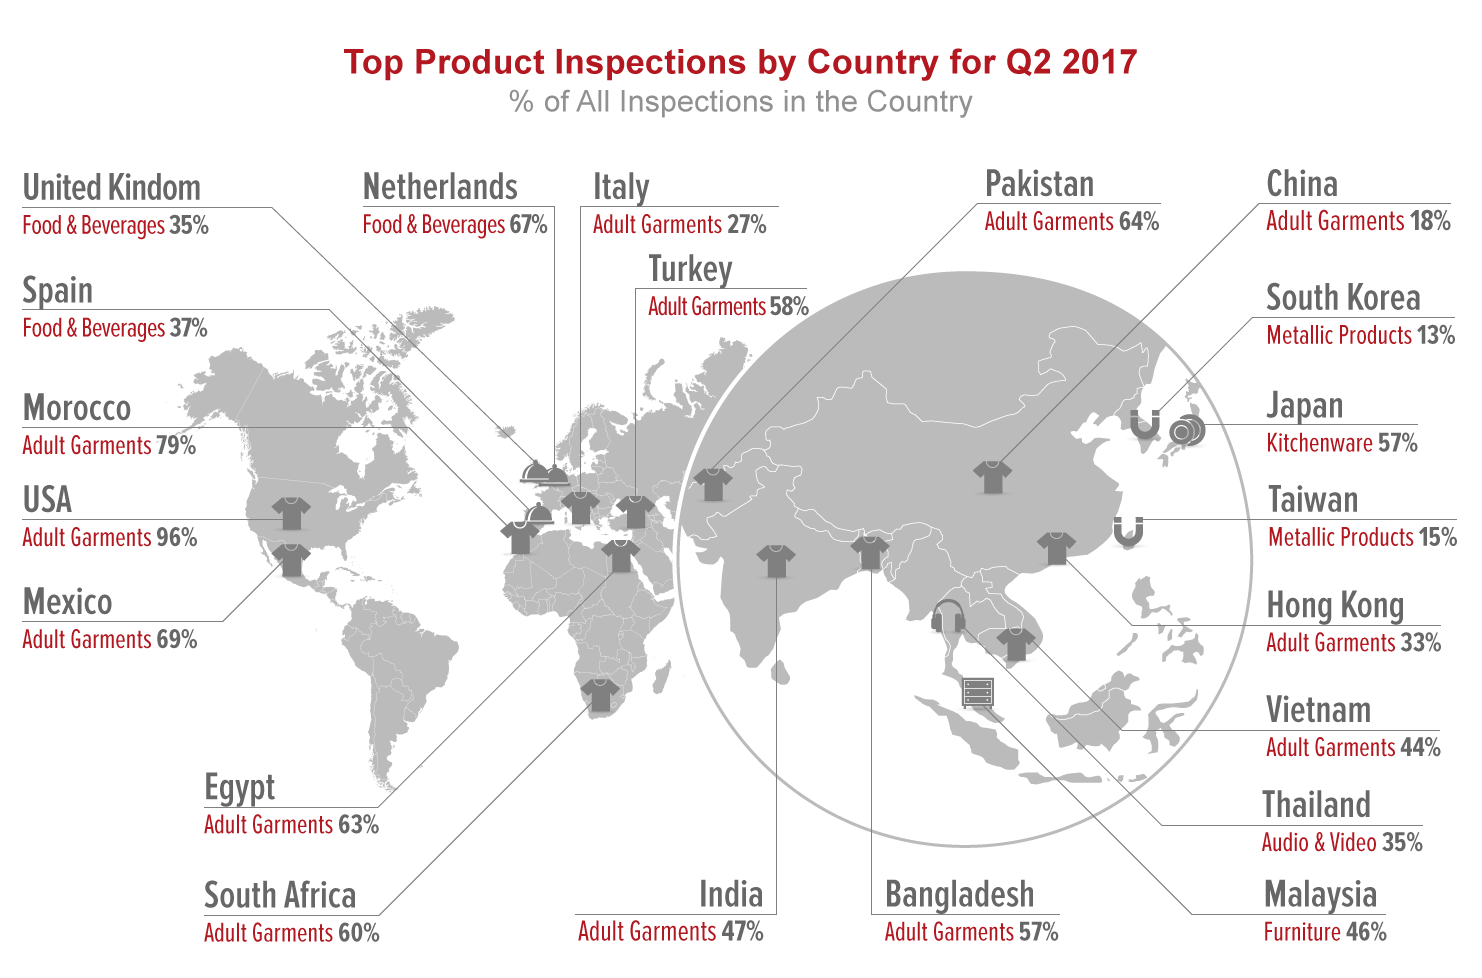
Global Sourcing Trends: China Keeps Up Growth Pace, Regional Competition Not Far Behind
Halfway through 2017, QIMA's onsite inspection and supplier audit statistics paint a picture of the ongoing struggle between old-school sourcing giants and their up-and-coming competition. China is still keeping ahead of its projected economic growth of 6.5% in 2017, with inspections and audits volumes rising +15% YoY in Q2 2017. Its competitors in Southeast Asia are not far behind: for instance, inspection demand in Vietnam and Cambodia in Q2 2017 rose by +10.4% and +25.4% respectively, in line with recent projections for the region’s robust economic growth in the medium term.i By contrast, in South Asia, where countries continue to see reduced economic growth in 2017, inspection and audit demand remained more sluggish, with the exception of Pakistan, which achieved +6.6% YoY growth this quarter after a rough start to the year.
Meanwhile, South Africa confirms its rise as a strong regional contender for apparel manufacturing outside of Asia, with second quarter’s inspection volumes rising +7.7% YoY.
2017 is Proving Challenging to Ethical Compliance and Structural Safety
QIMA data from Q2 2017 shows that manufacturers still struggle with ethical compliance across many industries and sourcing destinations. During the past quarter, up to 32.5% of factories were scored "Red" for critical non-compliance (vs. an average of 27% in 2016). The percentage of fully compliant "Green" factories dropped several percentage points to 27.5%, while 40% of factories received an "Amber" ranking, indicating that they still required improvement.
In terms of ranking criteria, working hours and wages compliance was tied with waste management for the lowest average scores of 6.7 out of 10 (at the end of 2016, average scores in these categories were 7.3 and 7.1, respectively).
Regional disparity of ethical scores was less pronounced this quarter. In China, factories appear to be on a downward trend, as average ethical scores decreased by 3.8% in 2017 YTD compared to 2016, to an average of 7.6.
Meanwhile, suppliers in South and Southeast Asia are scoring higher than China YTD with 8.6 on social compliance, a +9% improvement vs. 2016.
Among the industries serviced by AI, the E&E sector, by essence more automated and technically advanced, had the best ethical scores: 8.2 out of 10 compared to the cross-industry average of 7.5. By contrast, ethical performance in the textile and apparel industry has been slipping since the start of 2017, scores dropping from the 2016 average of 7.8 to 7.2/10 in Q2 2017. This goes to show again that the more labor-intensive the industry, the more prone it is to social and ethical shortcomings.
"From the data our auditors collect on the ground every day over the course of thousands of audits, it is obvious that significant progress of ethical compliance in global supply chains is still uneven and won’t happen overnight," said Sebastien Breteau, the founder and CEO of QIMA. "It’s a long-term game of incremental improvement: regular onsite follow-ups and close supervision are required if one wants real lasting impact on working conditions in factories."
QIMA data for the past quarter shows that uneven progress is also the case for the state of structural and fire safety of factories worldwide. On one hand, the ratio of compliant factories has crept up to 36.5% (vs. 33% in 2016); on the other, some 4% of factories were found to have immediate safety risks (vs. 2.5% at the end of 2016). Remediation is underway, but not complete, in up to 59.5% of factories.
Product Quality: Slow Improvement in Factory, Challenging Compliance in Lab
QIMA data for the first half of 2017 indicates that while in-factory quality of consumer goods shows gradual improvement, product compliance remains a challenge for global consumer product companies, both in terms of chemical controls and mechanical safety.
According to the latest test data from QIMA labs gathered from thousands of tests on consumer products (toys, hardware, and food contact items), in Q2 lead content exceeded the allowed limit in 13% of products tested in Asia and intended for the EU and US markets, while banned phthalates were found in some 9% of tested lots for the same destinations. 11.5% of products were found non-compliant with EU standards due to the unacceptable levels of chemicals restricted or banned under the REACH requirements.
Compliance with physical and mechanical requirements also presented a challenge to manufacturers this past quarter, as 10% and 7% of products headed for the US and EU markets respectively failed tests for mechanical hazards and small parts. Safety requirements in this area may require stricter enforcement, as recalls for choking hazard due to detachable small parts were frequent in the second quarter of 2017 – including with fidget spinners, the latest toy craze.
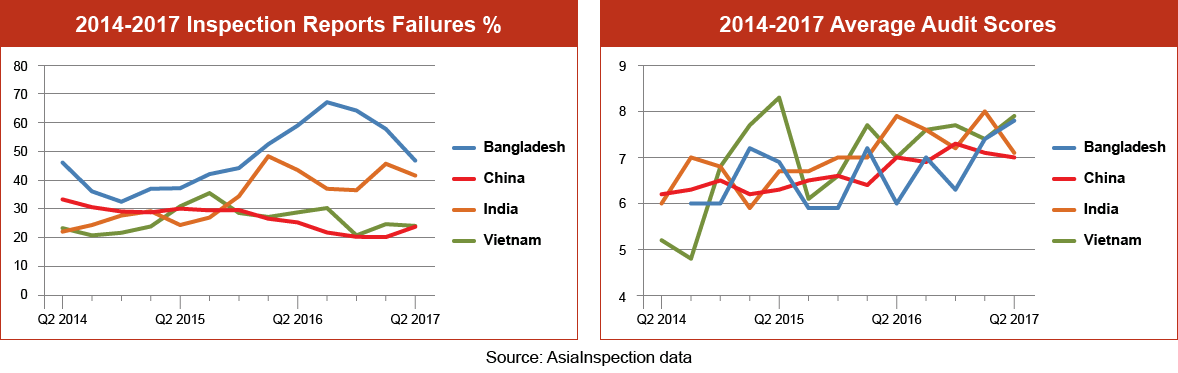
Meanwhile, in factories, quality of production batches improved slightly this quarter, as the percentage of failed inspections has stabilized around 32.5% for YTD 2017, a four-point YoY drop compared to 2016.
This dynamic is present, to various degrees, in many major sourcing destinations. Some 31% of goods made in China came short of specifications in 1H 2017, vs. 33% in 1H 2016. In many sourcing destinations across Asia, rejection rates also slipped a few percentage points. That said, major South Asian sourcing hubs such as India, Pakistan, and Bangladesh still perform poorly on quality, as between 49% and 54% of onsite inspections find more defects than allowed.
Quality performance by industry remains disparate, the heavily manual Textiles sector maintains the worst record for inspection failure rates: around 40% of products inspected in Q2 2017 were found outside acceptable quality limits. Rejection rates for Toys and Juvenile Products were marginally lower in 1H 2017 compared to the previous year (29% vs. 31%, respectively); the E&E sector performed similarly (25% in 1H 2017 vs. 27% in 1H 2016). The quality of Accessories and Eyewear Products, following a notable improvement earlier this year (see QIMA's previous barometer), appears to have plateaued, with the percentage of failed inspections around 20% and 13% respectively.
QIMA Barometer Key KPIs
Press Contact
Email: press@qima.com
i. Economic Outlook for Southeast Asia, China and India 2017
http://www.oecd.org/dev/economic-outlook-for-southeast-asia-china-and-india-23101113.htm